
The American Copper Imperative
The United States consumes about 2,200 kt of refined copper a year, mines about 1,000 kt, and refines 850 kt. Closing that gap takes the whole chain: more ore, more capacity to smelt and refine it, and allied supply while domestic capacity is built.
Sixteen primary copper smelters operated here in 1976. Two operate today, with a third in care and maintenance. The demand is concrete: the data centers, transmission lines and factories that will use the copper are under construction now.
Read the analysis →Get in touchAmerica mines copper it does not finish.
The United States produces about 1,000 kt of copper a year and ships roughly a third of it back out as ore and concentrate. The narrow point is smelting and refining, the midstream of the copper supply chain: the industrial capacity that turns concentrate into metal. Domestic refineries produce 850 kt against consumption near 2,200 kt, and imported metal covers the difference.
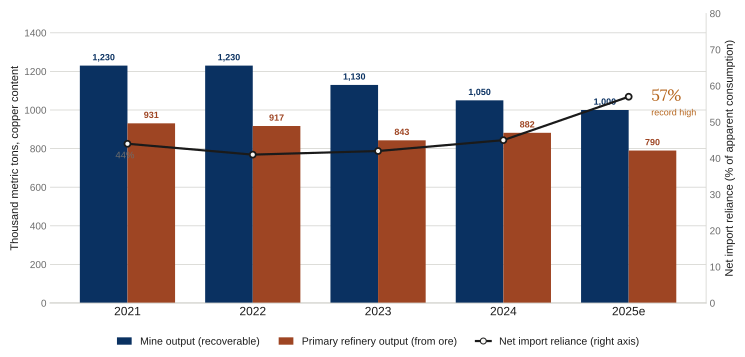
The shortfall is persistent rather than recent. Net import reliance for refined copper has been 40% or higher in every year since 2021: 44%, 41%, 42%, 45%, and 57% estimated for 2025. S&P Global’s 2022 outlook put U.S. import reliance between 57% and 67% by 2035. Today’s level is the low end of that range.Read any single year with care: USGS attributes the 9% fall in 2025 refinery output to planned maintenance rather than closure, and publishes two consumption lines, apparent consumption of 2,200 kt, used throughout this page, and reported refined consumption of 1,700 kt on a narrower basis. The persistence of the shortfall, more than the size of any one year’s gap, is the durable point. S&P Global, “The Future of Copper,” July 2022, p. 59. USGS Mineral Commodity Summaries 2026, salient statistics (2025 estimated).
The U.S. mines more copper than it refines
Mine output and primary refinery output both falling; imports now cover well over half of demand. 2021–2025e.
Sixteen smelters in 1976. Two today.
How the U.S. lost copper self-sufficiency, 1900–2020
Domestic refined copper output as a share of U.S. apparent consumption. Above the dashed line, the country refined more than it used.
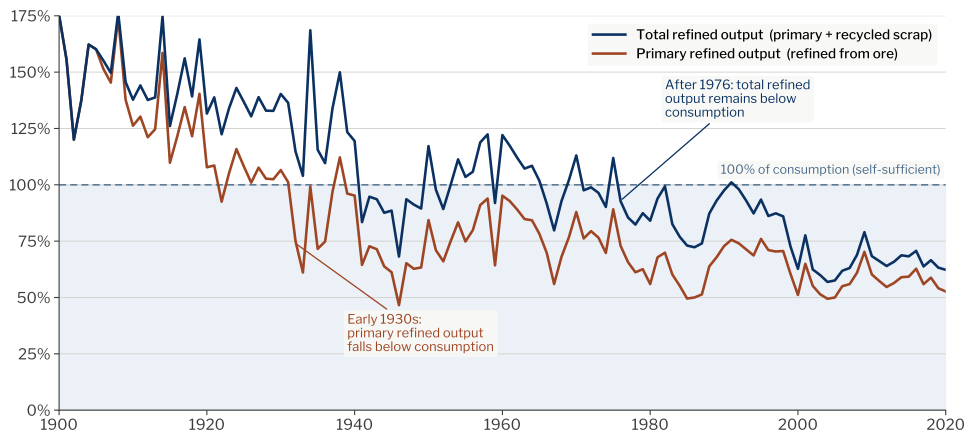
For most of the 20th century America made its own copper. The United States exported more refined copper than it imported in every year from 1900 to 1940, and it has not been a net exporter of refined copper since 1975. Copper from Arizona, Utah and Montana built the American grid and the manufacturing base behind it.
The midstream then moved abroad. Testifying to the House Natural Resources Subcommittee on Energy and Mineral Resources in April 2026, Adam Estelle of the Copper Development Association put the change plainly: “In 1976, the United States operated 16 primary copper smelters. Today, only two are operational, with a third currently mothballed.”
Those closures reflected economic and regulatory pressures over several decades. Rebuilding the capacity requires capital, permits, and secured feedstock.
The two operating primary smelters are Freeport’s Miami smelter in Arizona and Rio Tinto’s Kennecott smelter in Utah. USGS counts two primary smelters, two secondary smelters, two primary electrolytic refineries, fourteen electrowon refineries, and four secondary refineries.Testimony of Adam A. Estelle, President and CEO, Copper Development Association, U.S. House Committee on Natural Resources, Subcommittee on Energy and Mineral Resources, hearing “Powering the 21st Century with American Copper,” 29 April 2026. Facility census: USGS Mineral Commodity Summaries 2026.
The country built this capacity once.
Why domestic capacity matters now.
The demand is being built in the U.S.
The next build-out is physically tied to the United States: data centers, the electrical grid, transmission, electric vehicles and charging, reshored manufacturing. Copper is the conductor in all of it, and it is installed where the load is.
Testifying to Congress in April 2026, the Copper Development Association put it directly:“Every gigawatt of new AI computing capacity requires thousands of tons of copper.”Microsoft’s US$500 million data-center facility in Chicago used 2,177 tonnes, about 27 tonnes a megawatt. BHP expects data-center copper demand to rise roughly six-fold by 2050, to about 3 Mt a year.
The 27 tonnes is per megawatt of applied power, including on-site and near-site power connections. Testimony of Adam A. Estelle, Copper Development Association, House Committee on Natural Resources, Subcommittee on Energy and Mineral Resources, 29 April 2026. BHP Insights, “Why AI tools and data centers are driving copper demand,” 20 January 2025. Published per-megawatt estimates vary with scope, from about 12 tonnes for facility-only to 30–45 tonnes for AI-dense halls.Global copper finishing has concentrated in China
China has added most of the world’s new copper smelting and refining capacity. The pricing that governs the business now leaves little margin for independent industrial facilities anywhere.
Since 2005 China has accounted for over 90% of the growth in global copper smelter output,lifting its share from around 15% to half of global supply in 2025. Wood Mackenzie attributes 97% of new smelting and refining capacity added since 2019 to China. The benchmark treatment charge, what a smelter is paid to process concentrate, has collapsed to$0 a tonne for 2026, against US$21.25 the year before.
IEA commentary, “Copper prices have hit record highs, but smelters face mounting strategic pressures,” 2 March 2026 (share of smelter output). Wood Mackenzie,Horizons: “Securing copper supply: no China, no energy transition,” August 2024 (share of capacity additions — a different measure). Reuters, 19 December 2025 (2026 annual TC/RC benchmark settled at $0/tonne; spot charges separately traded negative).The global market is tightening
Demand keeps rising with electrification and AI while mined supply is projected to peak and then slip behind. S&P Global projects a structural deficit; the IEA projects a potential shortfall against the announced project pipeline.
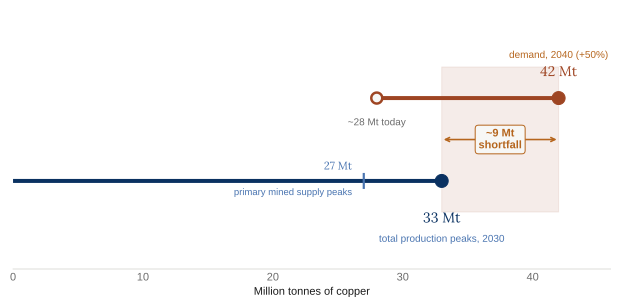
S&P Global projects global demand reaching 42 Mt by 2040, a 50% increase, against total production peaking near 33 Mt in 2030. That is a deficit of about 10 Mt, 25% below projected demand. The IEA separately projects a potential 30% shortfall by 2035 against announced mine projects.
S&P Global Commodity Insights, “Copper in the Age of AI: Challenges of Electrification,” 8 January 2026. IEA, Global Critical Minerals Outlook 2025(shortfall measured against announced project supply under the Stated Policies Scenario).Copper is now treated as strategic
The federal government has formally recognized copper as critical to the economy and to national security, opening federal permitting and program pathways to copper projects.
Copper was added to the U.S. critical minerals list on 7 November 2025, placing it among the materials the federal government treats as essential to the economy and to national security. Trade measures affecting copper have been introduced and adjusted several times since. Those measures change the cost of imported metal. The capacity to finish copper here is built facility by facility.
Federal Register, “Final 2025 List of Critical Minerals,” 7 November 2025 (90 FR 50494). This page does not state or track the current terms of copper trade measures, which are set by proclamation and have been amended repeatedly. For current status, consult the Federal Register.Global copper demand is set to outrun supply
S&P Global projects demand up ~50% to 42 Mt by 2040, while total production peaks at 33 Mt in 2030.
All four point at the same missing capacity.
Meeting demand takes every part of the chain at once.
Meeting projected demand takes more of everything: more ore permitted and mined, more capacity to smelt and refine it, and allied supply to carry the load while domestic capacity is built. Each part depends on the others. Ore that leaves as concentrate is finished somewhere else, and about a third of American mine output leaves that way today, because there are two smelters left to take it.
Every part of the chain has to expand. The middle has the most to build.
U.S. copper demand outruns U.S. refining capacity
Both S&P Global outlooks put 2035 demand far above what the country can refine today.
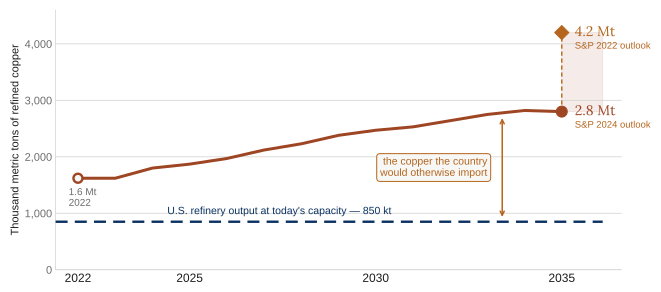
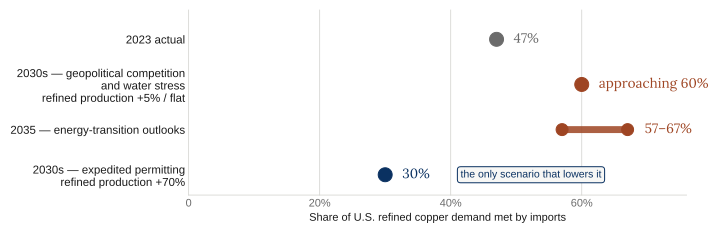
S&P Global models three futures for American copper. They differ mainly in one variable: how much copper the United States refines. Where domestic refined production rises 70%, import reliance falls to 30%. Where it rises 5%, or holds flat, reliance climbs toward 60%. Demand is held constant across all three.
On S&P’s own numbers, the variable that moves American import reliance is midstream capacity.
U.S. import reliance falls only where domestic refining capacity rises
S&P Global’s scenarios differ mainly in one parameter. Where U.S. refined production rises 70%, import reliance falls to 30%. Where it rises 5%, reliance approaches 60%.
America needs more copper. Every part of the chain has to expand to deliver it.
America needs a stronger copper supply chain. We are expanding it.
The U.S. consumes far more refined copper than it produces. Falcon Copper exists to close that gap. Falcon Copper is an American private company expanding and strengthening the domestic copper supply chain from end to end: across exploration, primary smelting and refining, and allied critical-minerals supply.
Three platforms across the chain.
- USGS, Mineral Commodity Summaries 2026 — Copper, published February 2026 (2025 data estimated): refinery output 850 kt (790 primary, 60 secondary); apparent consumption 2,200 kt; net import reliance 57% in 2025 and 44/41/42/45% in 2021–2024; mine production ~1,000 kt; exports of ore and concentrate ~340 kt; facility census. pubs.usgs.gov
- USGS, Data Series 140 — Historical Statistics for Mineral and Material Commodities (copper) (century self-sufficiency series and refined-copper trade columns; measured data, no projection. Net exporter in every year 1900–1940 and in 57 of the 77 years through 1976; net importer in every year since 1975). usgs.gov
- Federal Register, “Final 2025 List of Critical Minerals,” 7 November 2025, 90 FR 50494 (copper added). federalregister.gov
- Testimony of Adam A. Estelle, President and CEO, Copper Development Association, to the U.S. House Committee on Natural Resources, Subcommittee on Energy and Mineral Resources, hearing “Powering the 21st Century with American Copper,” 29 April 2026 (16 primary smelters in 1976; two operational today, with a third mothballed). docs.house.gov
- Testimony of Adam A. Estelle, President and CEO, Copper Development Association, to the U.S. House Committee on Natural Resources, Subcommittee on Energy and Mineral Resources, 29 April 2026 (“Every gigawatt of new AI computing capacity requires thousands of tons of copper”). docs.house.gov
- IEA commentary, “Copper prices have hit record highs, but smelters face mounting strategic pressures,” 2 March 2026 — since 2005 China has accounted for over 90% of growth in global copper smelter output, lifting its share from around 15% to half of global supply in 2025. Measures share of output, not capacity. iea.org
- BHP Insights, “Why AI tools and data centers are driving copper demand,” 20 January 2025 (Microsoft Chicago facility: US$500 million, 2,177 t copper, 27 t/MW; global data-center copper demand rising roughly six-fold by 2050). bhp.com
- Wood Mackenzie, Horizons: “Securing copper supply: no China, no energy transition,” August 2024 (China 97% of global smelting-and-refining capacity additions since 2019, >3 Mt and ~US$25bn; 75% of global smelter capacity growth since 2000). woodmac.com
- Reuters, 19 December 2025 — 2026 annual copper TC/RC benchmark settled at $0/tonne between Antofagasta and a Chinese smelter, against US$21.25/tonne for 2025. Spot treatment charges separately traded negative; the annual benchmark did not.
- S&P Global Commodity Insights, “Copper in the Age of AI: Challenges of Electrification,” 8 January 2026 — global demand 42 Mt by 2040 (+50%); total copper production peaks ~33 Mt in 2030, with primary mined supply peaking near 27 Mt; deficit ~10 Mt by 2040, 25% below projected demand. spglobal.com
- S&P Global Market Intelligence, “Copper in the US: Opportunities and Challenges,” 2024 (data compiled 28 February 2024) — U.S. refined copper demand path to 2035 (p. 39, and the same path on pp. 41 and 43); scenario parameters for U.S. refined production — +5%, +70%, no change (p. 37); import reliance 47% in 2023, approaching 60% in the 2030s under two scenarios and 30% under expedited permitting (p. 44). S&P states the study was supported by the Copper Development Association, which provided no data or substantive input.
- S&P Global, “The Future of Copper: Will the looming supply gap short-circuit the energy transition?” July 2022 — U.S. import reliance of 57–67% of copper needs by 2035 (p. 59); U.S. refined copper deficit of “just more than 2.4 MMt in 2035” in the High Ambition Scenario (p. 60) and 2.8 MMt in the Rocky Road Scenario (p. 62).
- IEA, Global Critical Minerals Outlook 2025 — a potential 30% copper supply shortfall by 2035, measured against announced mine projects under the Stated Policies Scenario. The IEA publishes this as a percentage and does not publish a corresponding tonnage. iea.org
Also in Perspective
How the country built the capacity to make its own copper, and how it lost it, from Indigenous metalworkers and Paul Revere to national electrification.
Read →America has decided to build again, and copper is the one material every part of it depends on. Where copper sits in the rebuilding of American industry.
Read →August 2026. U.S. figures on the USGS Mineral Commodity Summaries 2026 basis, published February 2026; 2025 data are USGS estimates. Other figures carry their own sources above. Figures are stated as at the date of publication and are not updated between editions.
This page is a market perspective prepared by Falcon Copper for general information. Third-party data is reproduced as published by the named source. Falcon Copper has not audited or independently validated the underlying data or methodologies, and does not warrant their accuracy. This page is not a technical disclosure of mineral resources, mineral reserves, exploration results, or project economics.
Statements about future markets, demand, supply, and policy are forward-looking and subject to change; actual outcomes may differ materially. Company statements describe publicly announced matters at their stated status only. Nothing here is an offer to sell or a solicitation of an offer to buy any security, and nothing here is investment, financial, legal, or tax advice. See full disclosures.